
By Saumen Chattopadhyay, CFA®, Senior Vice President, Investment Platform
If you’ve paid attention to market prognostications over the last year, you’ve likely heard the term “yield curve.” The yield curve has become the center of attention for explaining the economy and markets, which is why our financial advisors always seem to be answering one question: What is the yield curve?
The yield curve is the visual representation of interest rates and different maturities of fixed income securities. The “curve” of this graph shows us how these rates trend currently and are expected to continue.
What Makes Up the Yield Curve
A fixed income security, commonly known as bond, is a loan that the bondholder makes to the bond issuer. As with every loan, a bond pays interest periodically and repays the principal at the end of the loan term, known as maturity.
Short-term interest rates worldwide are administered by nations’ central banks. In the United States, the Federal Reserve (the Fed) conducts monetary policy and sets the federal funds rate, the benchmark for other short-term interest rates.
The Federal Reserve Board’s Open Market Committee (FOMC) raises and lowers the Fed funds rate that influences the overall supply of money and credit in the economy. The FOMC sets a target, which is known as the effective federal funds rate (FFR). This is the benchmark interest rate used by banks and other depository institutions for the overnight borrowing and lending to meet short-term business needs.
What Makes the Curve Happen
The shape of the yield curve depends primarily on two factors:
- Maturity Risk Premium: Investors expect extra returns for the added risk of holding bonds for a longer period of time. These added returns are called maturity risk premiums.
- Term Premium: The expectation about future economic growth, inflation and monetary policy is called term premium.
Demand for money is higher when the economy is growing because great spending activity demands higher funds to finance projects. High demand, in turn, drives up interest rates. Higher inflation is usually caused by strong economic growth.
Thus, in periods of economic expansion, investors expect the bond yields with longer-maturity to be higher than shorter-term because they expect future higher interest rates as well as inflation. This difference between short-term and long-term rates is known as “the spread.” Higher spread gives an upward sloping yield curve.
A Steep Yield Curve
A steep yield curve is typically a positive sign for the economy, meaning that investors expect higher interest rates and inflation. It indicates investors are confident about putting money into stocks and private sector bonds, therefore long-term government bonds have to offer higher yields to attract buyers.
In mid-February 2013, the short-term, two-year interest rate was 0.29% while the10-year interest rate was 2.05%. That 1.76% difference in interest compensated the investor for investing over a longer period of time. Below was the upward sloping yield curve from mid-February 2013.
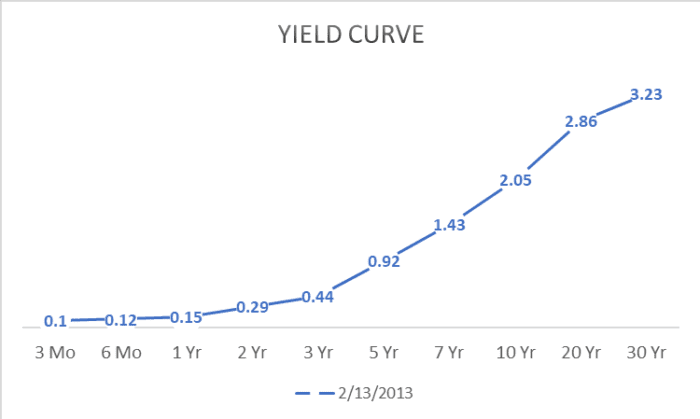
Source data: Treasury.gov
On the other hand, slower economic growth reduces the demand for money when businesses are less likely to produce more or finance projects with loans. Lower demand for loans puts downward pressure on interest rates.
Also, during weaker economic growth, the Fed is more likely to reduce short-term interest rates to encourage people to borrow and spend. For example, the FOMC lowered its target for the federal funds rate to near zero at the end of 2008 to support the economy during financial crisis.
A Flat Yield Curve
A flat yield curve indicates that little if any difference exists between short-term and long-term rates for bonds and notes of similar quality. Flat curves often indicate the economy is slowing down and investors are uncertain about the future path of the economy, including aggregate demands, inflation and the future value of stocks and bonds.
In December 2018, the short-term, two-year interest rate was 2.78%, while the10-year interest rate was 2.89%. That 0.11% difference in interest compensates the investor for investing over a longer period of time, but it isn’t much different than the short-term rate, therefore it’s called “flat.” Below was the flat yield curve from December 2018.
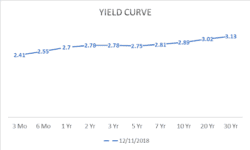
Source data: Treasury.gov
An Inverted Yield Curve
An inverted yield curve happens when short-term interest rates are higher than long-term rates. This seems like a paradox at first glance – why would investors settle for lower yields holding longer maturity compared to shorter-term? This is because they expect the future rates to be even lower, as they have little to no faith in the economy going forward. A negative term spread (typically, the difference between 10-year and 2-year yield) evidently predicts weaker economic growth in the future with a high probability of recession.
Economic research shows the yield curve was inverted (measured in terms of the difference between 10-year and 1-year treasury yields) prior to every recession from January 1955 to February 2018.
Although inversion of the yield curve is considered a harbinger of a recession, the inversion alone does not necessarily indicate an impending recession. But the longer the yield curve stays inverted, the better it predicts recession, especially in the United States, when it’s associated with a rising effective federal fund rates (FFR).
If you go in for such omens as the Super Bowl indicator, the inverted yield curve is basically an AFC win, and they’ve been collecting rings for quite a few years now.
In February 2007, the short-term two-year interest rate was 4.82%, while the 10-year interest rate was 4.68%. That -0.14% difference in interest compensates the investor for investing over a longer period of time, and thus the short-term was less than the long-term. Below was the inverted yield curve from March 2007.
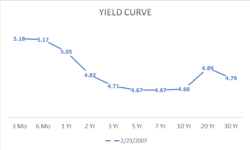
Source data: Treasury.gov
How to Read the Curve
Although the shape of the yield curve shows expectations of interest rates and economic activity, it is important to distinguish the drivers of the short end and long end of the curve.
The short-term interest rates are a function of the Fed FOMC’s monetary policy actions with its target federal funds rate. The Fed FOMC “eases” by lowering the target rate and “tightens” by increasing the target rate. On the other hand, the changes in higher yields on longer-term maturity can indicate future economic growth and inflation.
The yield curve is often considered a leading indicator for the direction of an economy. However, it’s important to remember that there are some inherent limitations on what investors can learn from just looking at the yield curve.
Use the yield curve as a resource along with your financial advisor, but don’t rely on one single data point in your decision-making process. Your advisor should be able to help guide you with all the information at his or her disposal.
Schedule an appointment with a Carson Wealth advisor today to get started building your plan.
